This was intended to be longer originally, my bad
Intro
I dislike the global financial system. It has been used either as a cause of – or justification for – many bad things that have been done since its inception. The mere existence of it pressures organizations and individuals to prioritize money, an abstract concept, over all else, including stuff of true material import. As such, I decided to use, and document in this mini paper, my usage of my personal most powerful weapon, that of data and programming and knowledge, to combat these foes, using a data-driven quantified strategy. In this essay, I will detail the methodology I used, along with the final product of my exposé of the financial system. This essay intends on using Network Analysis (NA) to examine the hierarchies of control that the financial system uses.
I. Network Analysis
In this section, I intend to use Network Analysis (NA) techniques to determine the interrelatedness of the financial system, and to display how the financial system forms a spider-web like network of companies owning other companies, that I will then expand on in later sections to display how it negatively affects people.
II. Methodology
In order to explore the interconnectedness of the global financial system, an NA approach was employed. The methodology involved the following steps:
- 1) Data Collection: I collected data from the SEC’s EDGAR (Electronic Data Gathering, Analysis and Retrieval) database, via an automated scraping method, I was able to download the 13F forms for every single organization I view of importance here, which is every single organization with over 100 million dollars in assets.
- 2) Preprocessing: I then processed a all the form 13Fs, and processed them into a comma-separated-values file (CSV), which contained the columns "source", "target", "weight", with "source" representing the organization owning "weight" portions of securities in the "source" organization. This technique makes the jump from the CSV to the actual network very easy.
- 3) Network Visualization: Using the previously mentioned CSV, I was able to represent each organization as a node in my network, and each investment an edge in the network. This meant that each "source" and each "target" was a node, and each row of the CSV was able to be utilized to draw an edge, with a head at "target" and a tail at "source", along with being able to have the edges size graphically scaled in accordance with the "weight". I displayed this network using a variety of tools, in order to both see the network through different manners, and also in order to decrease the computational power I would need to expend to view the entire network.
- 4) Network Analysis: In this stage, I utilized numerous algorithms and functions in order to analyze the financial network from the previous stages. The algorithms are network centrality measures such as degree centrality, betweenness centrality, and eigenvector centrality in order to identify the most influential organizations within the network. I also utilize community detection algorithms, such as Leiden Community Detection, Surprise Community Detection, and Walktrap Community Detection. Additionally, I compute various network metrics, such as the clustering coefficient, the average degree, and the network’s connectivity
I.III Network Metrics and Interpretation
One of my key critiques of the current global financial system, is the centralization of it, and how a few key organizations single-handedly heavily impact the system which in-turn heavily impacts all of our lives and our society. In this section, I intend on identifying the key players, and analyzing their respective control of the global financial system, using numerous network analysis techniques.
The first measurement I intend on applying, are several centrality measurements. Centrality is the measure of how much of the network is connected heavily to certain nodes (i.e. what the controlling or central nodes of a network are). The computations I did to determine the central nodes were several fold. The first I did was create a mapping, sorted in descending order, of the total amount of shares across all companies that all organizations had. The result of this calculation, the top 10 organizations by shares owned, is described in Fig 1.1
| Organization | Total Shares Owned |
|---|---|
| VANGUARD GROUP INC | 53398847455 |
| BlackRock Inc. | 50059865643 |
| STATE STREET CORP | 26264670770 |
| FMR LLC | 17338944626 |
| MORGAN STANLEY | 14610409364 |
| CITADEL ADVISORS LLC | 9276564342 |
| LINDEN ADVISORS LP | 9015297063 |
| LAZARD ASSET MANAGEMENT LLC | 8621096326 |
| GOLDMAN SACHS GROUP INC | 8114547893 |
| Invesco Ltd. | 7743142511 |
This table is, I believe, not very difficult to interpret. It portrays how two organizations, Vanguard Group ("Vanguard") and BlackRock Inc. ("BlackRock"), control approximately 30 billion more shares each than the organization with the third largest amount of share holdings, State Street Corporation, as they both hold around 50 billion cumulative shares. This reinforces my previously stated theory – that a handful of organizations control the vast majority of the financial system. This is not only exemplified in my graph by the top two organizations by share holdings having each more than double the amount of shares than the organization directly after them (the organization holding the third most amount of shares), but is also exemplified by how, within the top 10 organizations by share holdings, the total amount of shares held drops from 53 billion, down to 7.7 billion, a 6, almost 7, fold decrease.
I also view it as important to view the unique investments by these organizatons (i.e. how many companies these organizations have invested in). The results of this check are detailed in Figure 1.2.
| Organization | Unique Investments |
|---|---|
| BlackRock Inc. | 52257 |
| MORGAN STANLEY | 43935 |
| ROYAL BANK OF CANADA | 30147 |
| Bank of New York Mellon Corp | 27530 |
| Invesco Ltd. | 22543 |
| UBS Group AG | 20469 |
| WELLS FARGO & COMPANY/MN | 18692 |
| CITADEL ADVISORS LLC | 17973 |
| DIMENSIONAL FUND ADVISORS LP | 17479 |
| VANGUARD GROUP INC | 16101 |
I find it interesting that Vanguard Group, which has the most securities owned, has the lowest unique investments (more than three times the top organization), meaning that it must own more securities per corporation, while BlackRock must own substantially fewer securities per organization. This demonstrates that both Vanguard and BlackRock exhibit substantial control in a way that other investment organizations, possibly excluding Morgan Stanley, don’t, which is that BlackRock can exhibit a sway in many organizations, and Vanguard can exhibit a larger sway in fewer, but far far from a negligible amount of organizations.
An important factor of the sway that organizations can exhibit, however, is measured via centrality values. For the purposes of this essay, while I did analyze the data for betweeness centrality, I do not believe that betweeness centrality plays that much importance into a financial investment network, as there is no “flow”, so to speak, of information or otherwise, in that network. I did, however, analyze, and will include, degree centrality.
Degree centrality measures the amount of connections, both into and out from, a node in a network (in this case an organization in the financial system), weighted against all other nodes. This, in the financial investment network, exemplifies how much pull an organization has, by demonstrating how much of the network is invested in, and invested from, that organization. By being invested in, it can impact its investors behavior, and by investing, it will impact the behavior of the organizations it invests in. Figure 1.3 shows the top 10 organizations by the degree centrality.
| Organization | Degree centrality |
|---|---|
| UBS Group AG | 0.07825744135619950000 |
| MORGAN STANLEY | 0.07808495958998620000 |
| WELLS FARGO & COMPANY/MN | 0.06712004730928450000 |
| Tower Research Capital LLC (TRC) | 0.06594963532426570000 |
| ROYAL BANK OF CANADA | 0.06420017740981670000 |
| BlackRock Inc. | 0.06073822195939290000 |
| CITADEL ADVISORS LLC | 0.05938300808200280000 |
| GOLDMAN SACHS GROUP INC | 0.05710378474275580000 |
| STATE STREET CORP | 0.05625369603784740000 |
From this figure, we can establish several facts. The first is that BlackRock does not have that many large institutional investors directly invested in it, but the top of the list, especially Tower Research Capital LLC, which has 9747 direct investments into other organizations itself, must have a large amount of investments into it, putting it as a strong, central, organization. It is also interesting to note that Vanguard Group does not show up on this list (they are number 12 however), leading to a possibility that they may not exhibit as much pull as Figure 1.1 initially made evidenced, but they would still exhibit a pull nonetheless.
I believe it is also worth noting, as I believe I have been neglecting to note, that all the other organizations (i.e. non-BlackRock and non-Vanguard organizations) also do exhibit a strong pull, possibly not as much as BlackRock (Vanguard, as has just been displayed, exhibits less of a pull), but the several organizations such as UBS (especially UBS as is evidenced by Figure 1.3), and also Morgan Stanley, Citadel Advisors, etc. control many aspects of our lives too, just not as much, but far far from a negligible amount.
In the provided repository, you can also look into example.html and example2.html, which both contain diagrams of the network. They will take a while and are resource intensive to load. It is suggested that you turn off physics while they are loading.
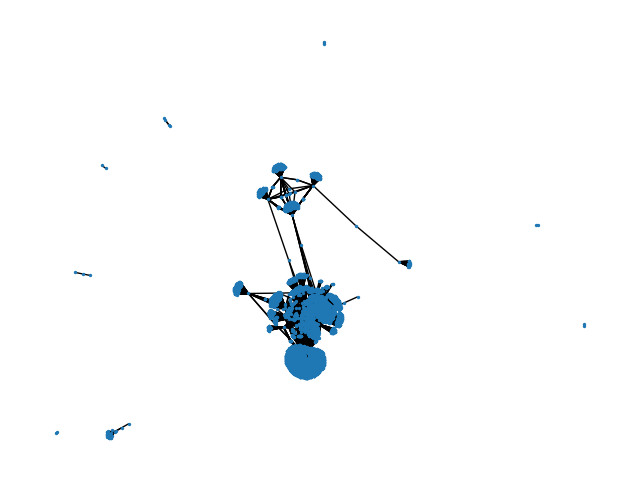
I also would like to present a graph, Figure 1.4, which is the rendered network. In it, you can see that there is one very tight cluster, all converging towards a few points, and a couple outliers, "spokes" so to speak.
Author's Notes:
I started working on this a while ago, and then lost it, and then found it again. After looking at it more closely, and finishing up some calculations, I do not believe that my initial theory is all that correct. I do believe that there is a lot of centralization in the financial system, and that the financial system is not a good thing, but I do not necessarily agree that centralization in the financial system is a good thing, but also not a bad thing necessarily. I will still finish this and post it, as I believe it to be interesting. Code and all other files are on codeberg.org/microbyte.
Finally, it is of note that in the actual SEC filings I looked at, Well's Fargo contains the literal "&" in it.
ALL CODE AT CODEBERG (idk what went wrong with pushing to main)